Understanding Bayes' Theorem
A powerful tool for updating beliefs based on new evidence
What is Bayes' Theorem?
Bayes' Theorem is a mathematical formula that describes how to update the probability of a hypothesis based on new evidence. It's named after Reverend Thomas Bayes, who first provided an equation that allows new evidence to update beliefs.
The Formula
P(H|E) - Posterior
The probability of the hypothesis after seeing the evidence
P(E|H) - Likelihood
The probability of the evidence given the hypothesis is true
P(H) - Prior
The initial probability of the hypothesis before seeing evidence
P(E) - Evidence
The total probability of observing the evidence
Why It's Powerful
Updates Beliefs
Allows you to systematically update your beliefs as new information becomes available, rather than starting from scratch.
Balances Evidence
Combines prior knowledge with new evidence in a mathematically rigorous way, preventing overreaction to single data points.
Real-World Applications
Used in medical diagnosis, spam filtering, machine learning, scientific research, and countless other fields.
An Intuitive Example
Medical Testing Scenario
Imagine a disease that affects 1% of the population. There's a test that's 95% accurate (both for detecting the disease and ruling it out). If you test positive, what's the probability you actually have the disease?
Most people guess around 95%, but the actual answer is surprising:
That's right—even with a positive test result!
👥Let's Walk Through the Numbers
Starting with 1,000 people tested:
Only about 1 in 6 positive tests indicates actual disease!
The key insight: Because the disease is rare (1%), the false positives from the large healthy population (49.5) vastly outnumber the true positives from the small sick population (9.5). This is why base rates matter so much—Bayes' Theorem helps us see this clearly.
Visualizing the Concept
Understanding Through a Venn Diagram
Let's visualize how Bayes' Theorem works using our medical testing example:
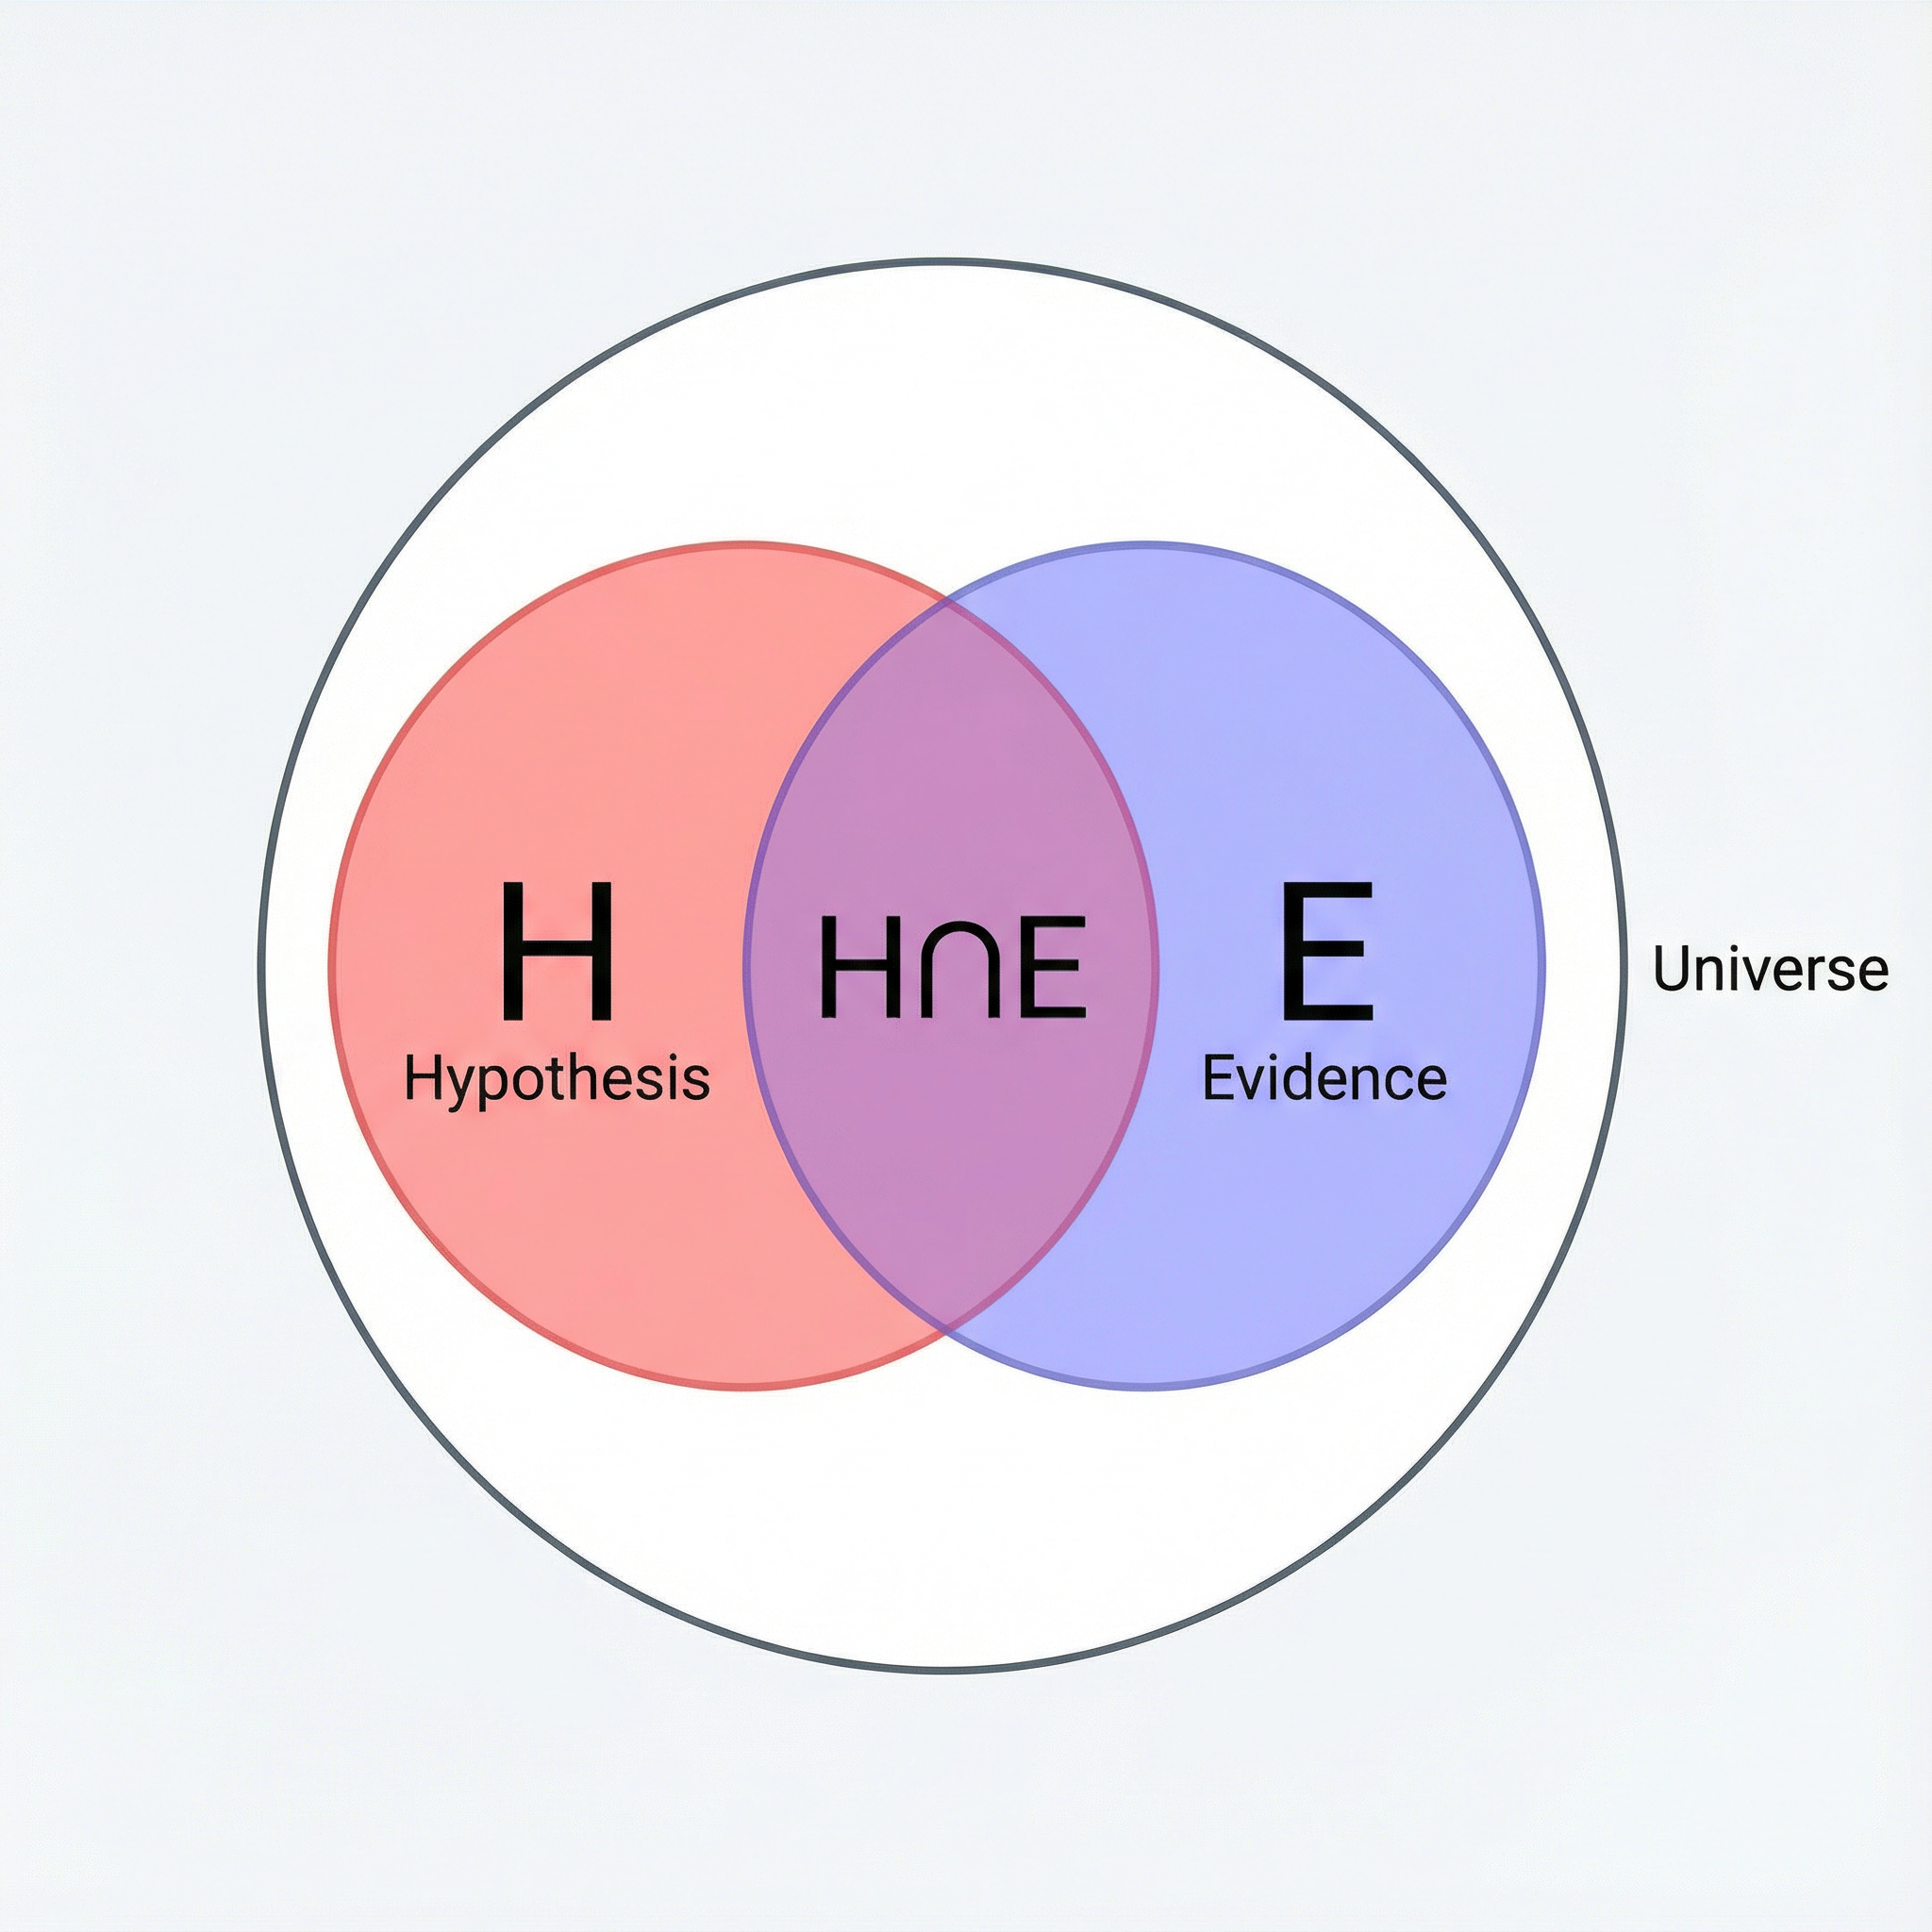
HLeft Circle: Hypothesis (Having the Disease)
This represents all people who actually have the disease. In our example with 1,000 people, this circle contains just 10 people (1% of the population).
ERight Circle: Evidence (Testing Positive)
This represents all people who test positive. In our example, this includes 59 people total: both those who truly have the disease (9.5) and those who got false positives (49.5).
⋂The Overlap: Both Have Disease AND Test Positive
This is the critical area—people who both have the disease and test positive (true positives). This is only 9.5 people. Bayes' Theorem calculates: What fraction of the "Evidence" circle is actually in the overlap?
P(Disease|Positive) = Overlap ÷ Evidence Circle = 9.5 ÷ 59 = 16%
💡 The Key Insight
The Evidence circle (positive tests) is much larger than just the overlap because it includes many false positives. When the disease is rare, most positive tests come from healthy people, not sick people. The Venn diagram makes this visually obvious: the overlap is a small fraction of the total Evidence circle.